The Free Traffic API That Needs Just One Call
Add a traffic map to your app. Just one traffic API call, that’s all.
Adding a traffic map to a web application is easier than you might think. After spending days researching the best way to do it, I’ve found it. I’ll save you the time of floundering through lots of traffic API documentation and show you how to do it with one simple line of HTML.
I thought it would be at least a week before I wanted to add a new screen to my DIY clock. As it turned out, the morning after I “finished” it I identified a new problem the clock could solve. By adding a screen with a traffic map I could figure out the best route to take to work that morning. Like most people, I have a preferred route, and a couple of alternatives in case there’s a traffic jam, accident, or some big event happening on the first choice route. I want to see an up-to-date traffic map that shows all three possible routes so I can choose the one with the least red in it.
There are several providers of traffic API’s out there. They all work differently. Some are paid, some have generous free usage limits before you incur any cost at all. Some are complex to interface with, and some are simple. I want this traffic map to display up-to-date traffic information on a web browser on a Raspberry Pi. I want a simple, free traffic API.
Google Traffic API
I looked at Google’s Traffic API, which is part of the Google Maps platform. My first goal was just to get driving times for my three route options. I ran into a bit of a challenge though. Google’s driving time API will return the driving time between two points, but it does not return the information telling you which route was taken for that drive time. To get routes from Google’s API is a far more complex operation than I was interested in getting into for this exercise.
I later found this map with traffic example page which shows a pretty straightforward way to get a map with a traffic overlay. By the time I found this, though, I had already taken another route (get it?).
Another strike against using this traffic API is that you have to create a billing account specifically for the Maps platform, even if you’ll stay under the limit of calls you can make and not exceed the credit you’re given each month (Google doesn’t give free API calls, they give credit, which amounts to the same thing as long as the credit keeps coming). To make it more of a pain, I already have a Google billing account on the Google Cloud Platform, but that isn’t good enough to get an API key for Maps, I needed to create a new billing account. Too much fuss for what I’m trying to do. It’s appropriate if I was trying to build something serious, but I’m after something quick and easy here. I’m not digging out the credit card for this.
TomTom Traffic API
Another common traffic API in search results is the TomTom Traffic API. The TomTom Traffic API provides an image of traffic flow to overlay onto a map, like this:
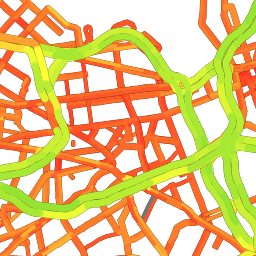
You would use TomTom’s Map API to get a map in one call, and a second call to their Traffic API for the same location and zoom level to get the traffic overlay for that map. That’s not a bad solution. For both the map and the traffic overlay you can get raster or vector response data to display.
The pricing gets weird in that the unit they track is a transaction, but some API calls are worth more or less of a fraction or multiple of a transaction than others. Depending on what you’re doing, the charge varies. I think that my little need would have been free, but it seemed like I would need a spreadsheet to figure how many ‘transactions’ I would be doing. I would have been well within the free allowance though.
Mapquest Traffic API
The Mapquest traffic API fit my needs perfectly, but I spent a while with it before I figured that out. Mapquest has about 20 different API’s. I was interested in traffic data, and went stright for the traffic API. You can get traffic data and incident data (like construction, closures,…) from the traffic API. After spending a long time getting the data I wanted from that API, I went in search of a map over which I could display all this data. The traffic overlays look pretty odd without roads, they’re just blips of red and orange scattered around, especially if you’re doing this at midnight when there’s little traffic:).
That’s when I started looking at the Static Map API. It turns out, I could get exactly what I wanted from the Static Map API alone. Let me save you the time, and show you how to get a traffic map in your application one API call.
Mapquest’s Static Map API
To use the Mapquest Traffic API and the other 19 API’s, you can sign up for a free account. You do not need to enter a credit card. You can use the free allowance of monthly API calls and then they cut you off until the next month. Perfect! No chance of incurring any charge unless I go in and upgrade my account and enter a credit card number. That’s a huge plus in my book, because you never know when some bug in your code might make 10,000 calls before you catch it, or somehow your API key gets ‘out there’. You get 15,000 transactions a month, which comes out to 500 a day in 30-day months. Plenty for home use.
To follow along with this example, you’ll need to know the lat/lon of (a) the center of your map, (b) your starting location, and (c) your destination. To find those, see How-To Find the Latitude and Longitude of Any Point which I used for the weather map on this same clock project. You’ll also need your free API key from Mapquest, the one they call ‘Consumer Key’.
To make a home for the map, I created a simple HTML document which contains one <div> element, which contains one <img> element.
<!DOCTYPE html>
<html lang="en">
<head>
    <meta charset="UTF-8">
    <meta name="viewport" content="width=device-width, initial-scale=1.0">
    <meta http-equiv="X-UA-Compatible" content="ie=edge">
    <link rel="stylesheet" href="traffic.css">
    <title>Traffic</title>
</head>
<body>
    <div id="map">
        <img src="">
    </div>
</body>
</html>
Now, all we have to do is build a URL for the src attribute of the <img> element. The browser will automatically make an HTTP GET request for that URL.
To get a basic map, we make this call – substitute your key for KEY and your lat/lon for the one in the example.
https://www.mapquestapi.com/staticmap/v5/map?key=KEY¢er=33.812172,-117.918968
Insert this between the quotation marks in the src attribute of the img element, open the HTML page in a browser, and you’ll see this:
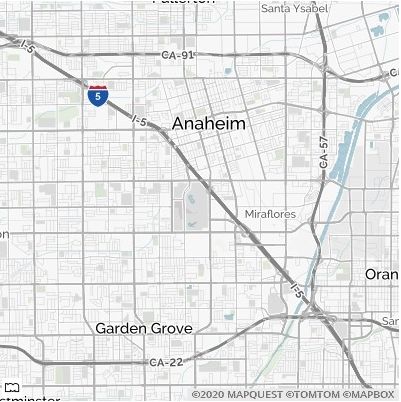
The map is centered on the lat/lon coordinates we provided. Now to frame it the way I want it. I added a ‘zoom’ parameter to the URL. You can use values from 10 to 18. Add the ‘&zoom=13’ parameter to the end of the URL, save the HTML file, and refresh the browser window.
https://www.mapquestapi.com/staticmap/v5/map?key=KEY¢er=33.812172,-117.918968&zoom=13You’ll see this:

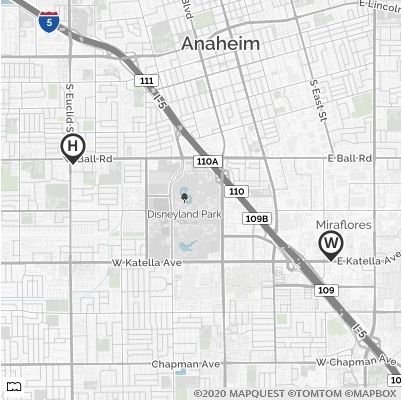
Now I want to add markers for home and work, so I can easily see where I’m going from and to. I simply add locations to the URL to get a default marker in each location. But instead of the default marker, I want to customize it. There are many customization options for the markers. You can change the colors, shapes, or even specify your own image file to act as the marker. In my case, I just wanted an ‘H’ for Home, and a ‘W’ for work. Here’s how the syntax goes for that, added onto the URL:
https://www.mapquestapi.com/staticmap/v5/map?key=KEY¢er=33.812172,-117.918968&zoom=13&locations=33.816996,-117.940852|marker-H||33.803059,-117.896641|marker-WThe parameter name is ‘locations’. Locations are lat,lon. Separate Lat/lon and their markers by a pipe ( | ), and multiple locations|markers by a double pipe ( || ). ‘marker-‘ plus a letter or number uses that letter or number for the marker. Here’s what it looks like now:
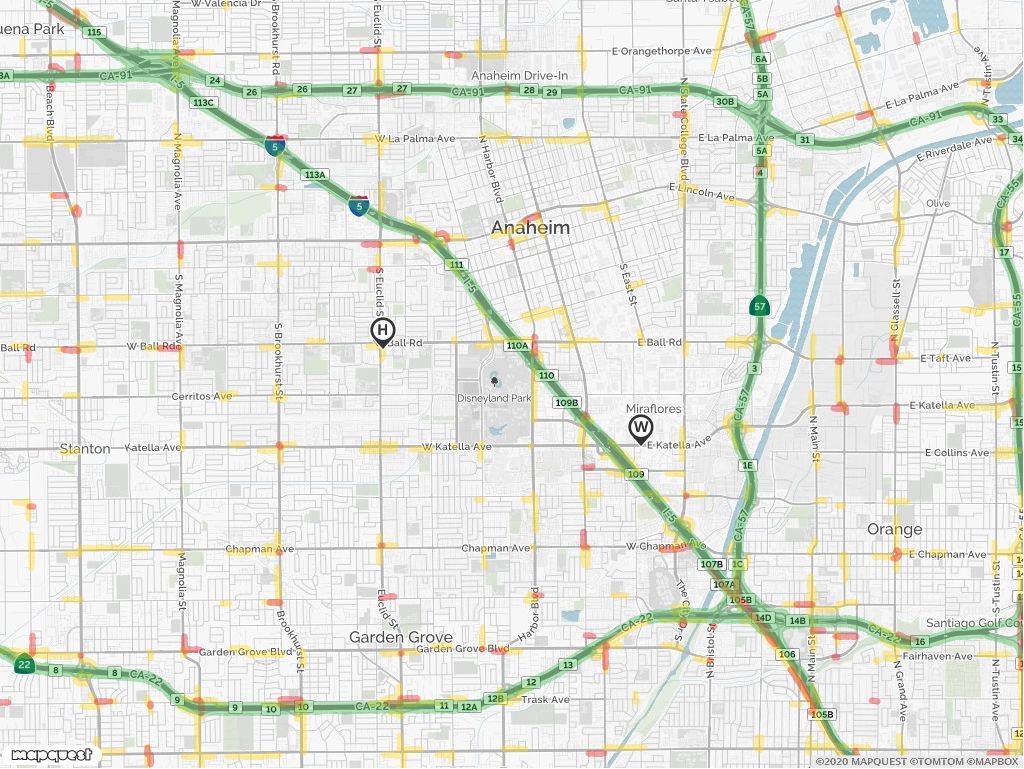
One last step, and that is to display the traffic information. Mapquest breaks traffic information down into three areas: flow, construction, and incidents. They all affect my driving time, so I want to see all three. Mapquest makes it simple. I added a parameter to the URL ‘traffic=flow|cons|inc’. That’s it. So now we have this as the source for the <img> tag:
https://www.mapquestapi.com/staticmap/v5/map?key=KEY¢er=33.812172,-117.918968&zoom=13&locations=33.816996,-117.940852|marker-H||33.803059,-117.896641|marker-W&traffic=flow|cons|incNow the map looks like this:
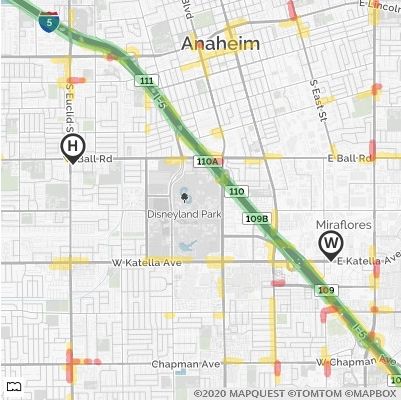
And there it is – the map, complete with markers for home and work, and showing traffic flow. Now at a glance I can see the best route to take to work. Right now it doesn’t look too bad, but this screenshot isn’t from rush hour.
There are more options for the map. I ended using a size option so I could get a map that filled my clock’s entire 7″ touchscreen. There is a banner option to overlay a banner at the top or bottom of the map. You can add lines, polygons, and circles to the map as well. You can also have the map highlight a route by giving it start and end points, but you don’t choose which route with this call. Since my goal was to figure out which route to take, I didn’t use that feature. You can also add a scale bar. And as I mentioned, there are a gazillion ways to customize the markers.
The completed HTML looks like this:
<!DOCTYPE html>
<html lang="en">
<head>
<meta charset="UTF-8">
<meta name="viewport" content="width=device-width, initial-scale=1.0">
<meta http-equiv="X-UA-Compatible" content="ie=edge">
<link rel="stylesheet" href="traffic.css">
<title>Traffic</title>
</head>
<body>
<div id="map">
<img src="https://www.mapquestapi.com/staticmap/v5/map?key=KEY¢er=33.812172,-117.918968&zoom=13&locations=33.816996,-117.940852|marker-H||33.803059,-117.896641|marker-W&traffic=flow|cons|inc">
</div>
</body>
</html>I added a simple CSS file so this screen would blend in with my clock and weather screens. My map size was 800 x 600, my entire CSS file is:
body {
    overflow: hidden;
    background-color: black;
}
#map {
    width: 800px;
    height: 600px;
    margin: 3px 3px 3px 3px;

}
I added a margin because the map was stretching beyond the screen. The overflow: hidden makes the browser lose the scroll bars, and I’ll never see the background-color, but just in case, you know.
Why Does it Work?
By using the API call’s URL as the source of the image, the browser makes an HTTP GET request to that URL. The API’s response to this call is an image, which is what the browser is expecting to find the src attribute of an image tag. It’s a perfect match. Most APIs return JSON or XML files which we would need to parse, navigate, and interpret to use. It takes coding to do that. In this case, no coding required (unless you consider this simple HTML to be coding).
However, this code does trigger a browser warning. It may not work forever. Mapquest uses a single cookie during this transaction, and it does not have a ‘SameSite’ attribute on it. To make a long painful story short, this is a security issue that browsers are working on enforcing. According to the Chromium Projects timeline, they will be rolling out enforcement starting in February of 2020. If API providers don’t add this attribute (and make the necessary CORS response header changes that many of them lack) then using API’s like this will require a more complex approach. We will have to move the API call to another process, taking the browser out of the equation. But that’s another story, outside the scope of this article.
For now, we have a working traffic map, updated every time we load the page. It was free. And we didn’t have to write any Javascript/jQuery/Python/whatever code to do it. I’m calling that a win!