DIY Clock-Weather-Plus Part 2
I show how to get weather forecast data from Dark Sky, use sexy icons from Skycons, and lay out a DIY weather screen. Part 2 of a series.
This is part 2 of a series of posts, which focuses on a DIY weather display page. DIY Clock Part 1 was about getting a time and date screen for a custom clock I’m going to build. Not having picked out specific hardware yet, I’m getting the logic for the clock in place on my PC.
Later, I’ll have to port this code to a Raspberry Pi, Arduino, or some such. All I know is that I’ll be looking for a 7-inch screen and WiFi connectivity.
This post, DIY Clock-Weather-Plus Part 2, is about the weather. Specifically, creating a screen for the weather, finding a source for the weather, and getting an acceptable solution to work.
DIY Weather with Dark Sky API
I read a few articles on weather API’s, and I researched a couple in detail. I settled on the Dark Sky weather API. The National Weather Service has one as well, but in the end I went with the more trendy Dark Sky, and I’m glad I did. I’ll explain why later.
To use the Dark Sky API, you have to sign up for a free account. Like most weather APIs, you are allowed 1000 calls to the API per day at no cost. In the case of Dark Sky, you can’t go over that limit unless you expressly upgrade your account and provide a billing method. I like that, because sometimes code gets stuck in a loop and fires off hundreds of requests before you realize it’s happening. At least, if you code like me, that happens from time to time. I may have been banned from some APIs before by accident. I mean, I have a friend who…oh, never mind. The point is, with Dark Sky’s API, you won’t incur any unexpected charges. Worst case is that you’ll have to wait until tomorrow to keep coding if you accidentally pummel their server with requests today.
There are two types of requests you can make with Dark Sky, a forecast request, and a snapshot request which they call a Time Machine request because you can make it for any date in the past or future. I’ll be using the forecast request.
To use the forecast API, it’s a simple GET request in the form:
https://api.darksky.net/forecast/[key]/[latitude],[longitude]The [key] is a private string assigned to you when you sign up for a free account. The latitude and longitude would look like ‘41.98, -87.91 ‘ (without the quotes) if you were at Chicago’s O’Hare Airport, for example.
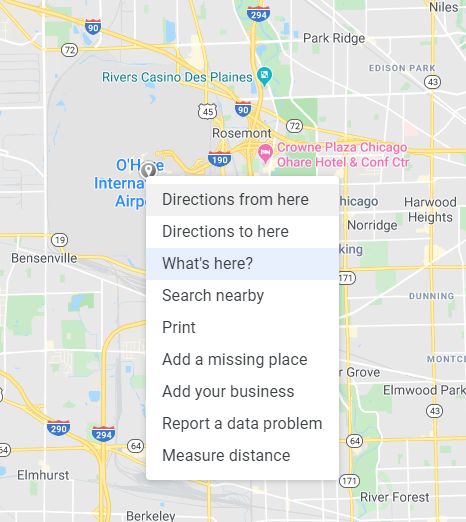
As an aside, here’s how you can get the latitude and longitude for any point.
Find the latitude and longitude for any point
- Load Google Maps
Navigate to https://google.com/maps


- Navigate on the map to the point you want the coordinates for


- Right-click on that point
- Select “What’s Here?”


- The latitude and longitude will display on the bottom center of the map


Back to our task at hand, getting the weather forecast information. All you need is your private key from Dark Sky, and the lat/lon of the place for which you want the forecast data.
API + CORS = P.I.T.A.
This clock project is entirely front end up to this point. The natural thing to do is to dive into the Javascript file and set up an Ajax call to get the forecast from the URL. That’s what I did, anyway. And I ran into a CORS Error. CORS is a constraint enforced by browsers to ensure that code from one site doesn’t run itself on another site. I’m oversimplifying to a very very large extent, and if you’re interested in the details, bless your heart and go read this article about CORS Errors on Mozilla. The gist of it is, the server needs to say that your location (origin) is allowed to access the content by responding with appropriate headers. And if you don’t have control of the server, there’s nothing you can do about it.
So, here’s what you do. You make your own server to call their server, thereby obviating the need for browsers to be included in the mix. I’m serious, and it’s easy. It’s less code than the front-end for sure.
For my project, I’m going to create a server to call their server via their API. Then, my front-end clock application will call my server to get the information. This actually has another benefit in terms of how many times I call the weather API. I don’t have to call their API for the forecast every time I want to display my weather screen. The server will call the API and store the response (the forecast information) in a file on the server. Then the server will feed that file back to my front-end application when it asks for it. The server can update the file every hour, making 24 calls a day to the API, well under the 1000 call limit. The client can call the server as many times as it wants, and it will get weather information no older than an hour, which to me seems plenty fresh for weather information.
I’m using Node.js, because it’s free, easy to understand, lightweight, fast, and I can program it in Javascript, a language I already know. I won’t go through the whole Node.js installation. If you don’t have it and you want to follow along, install Node.js. It takes a while, but it’s super-handy to have around.
Create a new directory for the server. Create a Javascript file in there using your editor of choice. I called mine wxServer.js.
There are essentially two functions in this file. One uses fetch to get the weather data from the API, and then it writes it to a file in JSON format. The data comes in JSON format, so easy-peasy. I set an interval timer to do that every hour.
The second function creates an http server. If a request comes in to the server at /wx, it reads the file and sends it back in the response. If a request comes in to any other path, it just says “Hi, I’m running, here’s what you typed in ____”.
Here’s the entire server code:
const fetch = require('node-fetch');
let http = require('http');
let fs = require('fs');

//For the Dark Sky API
let url = "https://api.darksky.net/forecast/TODO:putYourKeyInHere/TODO:yourLatLonHere";
let settings = { method: "Get" };


function updateWx() {
    fetch(url, settings)
        .then(res => res.json())
        .then((json) => {
            let data = JSON.stringify(json, null, 2);
            fs.writeFileSync("wx.json",data);
            //For debug only
            //console.log("json: " + json);
            //console.log("data: " + data);
        });
}
updateWx();
setInterval(updateWx,3600000);  //Update every hour

//serve the file in response to requests to "/wx"
http.createServer(function(request,response){
    if (request.url === "/wx") {
        fs.readFile("wx.json", function(err,data){
            response.writeHead(200, {'Content-Type': 'text/json',
                                    'Access-Control-Allow-Origin': '*',
                                    'Access-Control-Allow-Headers': 'Origin, X-Requested-With, Content-Type, Accept',
                                    'Access-Control-Allow-Methods': 'GET,PUT,POST,DELETE,OPTIONS',
                                    'Access-Control-Allow-Credentials': 'true'
                                    });
            response.write(data);
            response.end();
        })
    }
    else {
        response.writeHead(200, {'Content-Type': 'text/html'});
        response.write('<b>Hi!</b><br /><br />Weather server is running. Requested URL is: ' + request.url);
        response.end();
    }


}).listen(3000);
You might notice I added a bunch of headers in the /wx response. These are headers related to CORS. I am not sure which of them I need, it’s just become a block of code I copy and paste into each project because it works and I’m not trying to lock my servers up tight. If yours will be public-facing, then do some research and experimentation to see what the minimum you need to allow is and still function. For this, don’t so as I do, do as I say.
That’s it, that’s all the server code. Save that. At a command prompt type ‘node wxServer.js’, and your server is running. There will be (very shortly) a file in the same folder called wx.json. It is the response from the Dark Sky API with all the weather data in it. It gets sent as a response to any browser trying to load ‘localhost:3000/wx’.
Back to the Front (End)
Now that we have a place to get weather data from, let’s call it and get the data into Javascript to see what we can do with it.
Since the data is in JSON form, I used the JQuery Ajax call $.getJSON to get the data into Javascript. I created a function called getWx() to get the weather data from my server. This function gets the data into a variable creatively named, ‘data’. It then creates a displayable time and date from the time and date in the file called ‘currently.time’. Remember that the file gets updated by the server every hour, so this will give me an idea of whether the data is relatively current, or if the server stopped working a few days ago or something. I also pulled the time zone out and displayed it, since it was the only human-readable location readily available in the file. I can rest assured that yes, these are the data I am looking for.
The rest of the data contains information for the current conditions, minutely, hourly, and daily forecasts, as well as more data. It’s too much, really, it’ll be fun deciding what to display and how to display it. Instead of dealing with all that in this function, I’ve decided to modularize it and create separate functions to display the current conditions, the coming-soon conditions, and the longer-term forecast. I pass each function the section of the dataset it needs. I can write those later, and just stub them out for now.
function getWx(){
    $.getJSON('http://127.0.0.1:3000/wx',
                function(data) {
                    let wxDate = new Date(data.currently.time * 1000);
                    let wxMinutes = wxDate.getMinutes();
                    if(wxMinutes < 10)
                        wxMinutes = "0" + wxMinutes.toString();
                    document.getElementById("wxLocation").innerText = "Weather for " + data.timezone + " time zone";
                    document.getElementById("wxTime").innerHTML = "Updated: " + wxDate.getHours() + ":" + wxMinutes + " " + wxDate.getMonth()+1 + "/" + wxDate.getDate() + "/" +wxDate.getUTCFullYear();
                    drawCurrentConditions(data.currently);
                    drawNextConditions(data.hourly);
                    drawForecast(data.daily);
                }
    );
}
Accessing the JSON data in Javascript
I wanted to step back a moment and talk about how to get to the various bits of data from the code. Let’s take a look at a bit of the raw data. It’s in the wx.json file the server creates. It’s a character-for-character copy of what the Dark Sky API returned.
{
  "latitude": ------,
  "longitude": -------,
  "timezone": "America/Phoenix",
  "currently": {
    "time": 1579576371,
    "summary": "Overcast",
    "icon": "cloudy",
    "nearestStormDistance": 1,
    "nearestStormBearing": 120,
    "precipIntensity": 0,
    "precipProbability": 0,
    "temperature": 65.05,
    "apparentTemperature": 65.05,
    "dewPoint": 38.47,
    "humidity": 0.37,
    "pressure": 1016.9,
    "windSpeed": 4.27,
    "windGust": 5.98,
    "windBearing": 66,
    "cloudCover": 0.89,
    "uvIndex": 0,
    "visibility": 10,
    "ozone": 267.2
  },
  "minutely": {
    "summary": "Overcast for the hour.",
    "icon": "cloudy",
    "data": [
      {
        "time": 1579576320,
        "precipIntensity": 0,
        "precipProbability": 0
      },
...
At the very root level, we have latitude, longitude, timezone, currently, minutely, and more below. Nested into ‘currently’ and ‘minutely’ and other top-level items below are more items like ‘time’. This entire structure is loaded into the variable ‘data’ in my code above. This is done simply by virtue of declaring ‘data’ as the argument to catch the information passed to the callback function in the $.getJSON method above [function(data){…}]. From the top level, you can then access the ‘timezone’ element with ‘data.timezone’, and the current time (when the data was fresh) at ‘data.currently.time’. Because the data was returned in JSON format, I stored in JSON format, and I read it in in JSON format. This made it easy to work with. If the API had returned XML, I would have stored it that way, and loaded it that way too. There are mechanisms for XML which are just as easy, and more powerful in terms of formatting and navigating the data.
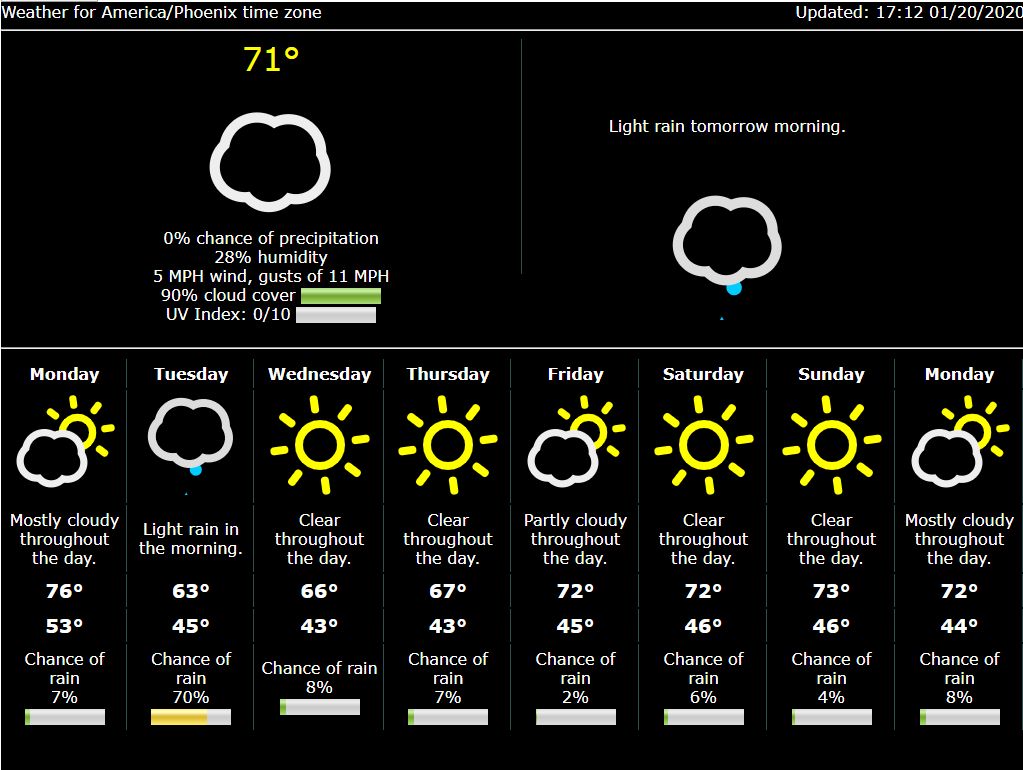
DIY Weather Display
To display the weather, I built an HTML skeleton much like the clock one in Part 1. The top “row” displays the timezone and date/time of the data. The next “row” displays the current conditions and coming-soon conditions. The third “row” displays the long term forecast. I placed all this on another 1024×768 “panel” in hopes of directly translating to the final screen.
Here’s the weather HTML framework. Just boring old div’s and spans this time.
<div class="wx">
        <div><span id="wxLocation"></span><span id="wxTime"></span></div>
        <hr>
        <div id="wxCurrent">
            <span id="currently"></span>
            <span id="coming"></span>
        </div>
        <hr>
        <div id="forecast">

        </div>
    </div>
The CSS is just constraining widths & heights, setting colors, alignments, font sizes, blah, blah, blah. I won’t bore you with it here. Experiment on yours and get it how you like it.
DIY Weather Made Attractive – Skycons
OK, so we now have all we need to get all this information displayed on a page. It’s actually interesting to read, but sometimes you just want to know what the weather is instead of studying it. In the data that Dark Sky gives you, there is a field in each set of weather conditions named ‘icon’. Dark Sky does not provide icons, but they do indicate the type of icon which would appropriately represent that block of weather conditions. Across the weather API industry there is a de facto set of weather icons. If you search for weather icons, you will rapidly see what that de facto set of icons consists of. You could get a set of free weather icons or pay for a nice set, minding whether you want light, dark, or transparent background, what sizes, color or monochrome, and so on.
If you’re using Dark Sky, I have a better suggestion. Use Skycons. First, they’re designed specifically for use with Dark Sky from a programmatic sense. Secondly, they utilize the HTML canvas element, which means they’re scalable, color-able, and animate-able. Oh yeah, they’re open-source, so there’s that going for them too.
If you’re on a DIY weather junket and go searching for Skycons, you’ll learn that the original set of Skycons is no longer supported. A newer set of them has taken on the same name and is available at Github. You can see samples of Skycons here. You do not need to know anything about Github to utilize these. If you have git and can use it, then you know what to do. If you don’t, you need only get the file called ‘skycons.js’ on your system, and include it in a <script> tag in your HTML, before your weather Javascript file.
Once you’ve done that, decide where you want to put them in your HTML file. In my Javascript, as I’m populating the <span id=”currently”> above, I create a canvas and place it in the span:
    elem = document.createElement("canvas");
    elem.id = "icon1"; elem.width = "128"; elem.height = "128";
    span.appendChild(elem);
Then, when all the elements are actually added to the document, I draw an icon on the canvas. To select which icon, I simply pass Skycons.add() the same string that Dark Sky gave me in the icon field! No need to translate any names, Skycons already knows Dark Sky’s icon strings and will draw the proper icon.
skycons.add("icon1",w.icon);
skycons.play();
The first line creates the proper icon on the canvas. In this context, w is the ‘currently’ section of the JSON file, so the string being passed is ‘currently.icon’ in the original JSON. The second line starts the animation of the icon. That’s it. The icon is rendered on the canvas and does its thing. Two lines of code, and bang! Your weather looks great.
There is one more thing to it. You have to declare a Skycons object, in this case it’s cleverly called ‘skycons’. When you construct the object, though, you can customize the colors of the various bits of the icons. Here’s how I did it.
let skycons = new Skycons({"monochrome": "false",
                                "color": {
                                    "main": "#fff",
                                    "light_cloud": "#EEE",
                                    "cloud": "#DDD",
                                    "dark_cloud": "#AAA",
                                    "sun": "#FF0",
                                    "moon": "#CCC",
                                    "fog": "#AAA",
                                    "thunder": "#33f",
                                    "snow": "#FFF",
                                    "hail": "#EEE",
                                    "wind": "#AAF",
                                    "leaf":"#2F2",
                                    "rain": "#0CF"
                                },
                            "resizeClear": "true"
                                });
To be honest, I don’t know if all the colors are great choices. Where I live I just need the sun to be yellow, and no one will know if the others are off. I could make purple rain, though. I wish I had thought of that earlier…
DIY Weather Display
The process of plowing through all the data and creating and appending HTML elements to contain them is a bit tedious and makes for long boring code. I won’t go through every step here. I’m happy to share anything if you’re interested, just ask. You’ve seen the idea though. I have a section in the HTML for current weather (‘currently’ in the data), a section for the coming-soon weather (‘hourly’ in the data), and the forecast (‘daily’ in the data). I have a function for populating each. It’s actually all set in motion with one function, which I put on an interval timer to update every hour. The underlying data only updates every hour, so there wasn’t much point in updating more often than that. I could be seeing data almost two hours old in the worst case. If you live in an area where weather changes quickly, set shorter intervals on the server’s call to the API to update the data, and shorter intervals from the front-end to update the display.
I skipped using the ‘minutely’ data returned from the API, at least on this screen. The data is cool, but this screen is too crowded already. Maybe the minutely data would be a good opportunity to experiment with graphing, on another page. Any simple graphing library recommendations?
Oh, I also experimented with the HTML <meter> element on some of the data. This is ‘DIY weather’ after all, what would be without a little experimentation? Frickin’ “Wednesday” is too wide and screws up the alignment of the “Chance of [precepitationType]” text and meter at the bottom of the table. I haven’t decided on fixing the spacing or pulling the meters out altogether. I’m not convinced they’re contributing all that much. Thoughts?
Important Note: The Dark Sky API requires attribution. From their documentation: ” You are required to display the message “Powered by Dark Sky” that links to https://darksky.net/poweredby/ somewhere prominent in your app or service. ” I caught this after-the-fact, but will definitely include it the next time we crack the code open. It’s a simple request on their part in exchange for a valuable service for free. I didn’t omit from the screenshot above intentionally.
In Part 3 of this series, I’ll start to look at hardware that can support what I need to build this monstrosity. If you have suggestions to pile on, or questions about what’s here so far, let me know in the comments below.
1 thought on “DIY Clock-Weather-Plus Part 2”